Automating Notebook Execution with Spark
Notebooks help data scientists to explore datasets and has became one of the main tools used in Data Science, but they also add some challenges like how to deploy in production or how to show the results to end users. In this article, I will introduce how we address these challenges at Tail by automating Notebook execution in Apache Spark.
Apache Spark is an engine that allows process big datasets using distributed machines. We can apply several operations to a dataset, like: filters, transformations, aggregations, machine learning algorithms, and data visualization. All these operations are used to generate data insights.
Spark Notebook is a tool (like Jupyter Notebook) that allows to create notebooks, composed by cells with code or texts, that can be executed in a Spark cluster. In practice, after creating a notebook we have a pipeline, that is a flow of data transformations, like:
- Read datasets;
- Clean and transform the data;
- Generate new features;
- Enrich your data from another datasets;
- Train machine learning models;
- Visualize the data;
- And get insights.
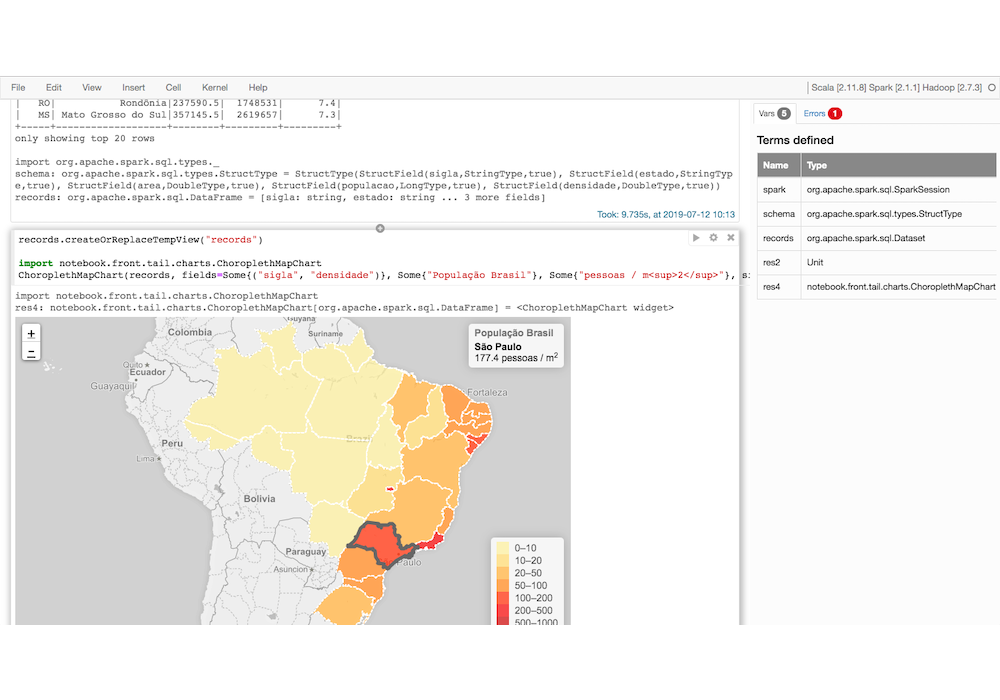
In Figure 1, we have a sample of Spark Notebook showing a cell that generates a chart as output:
Figure 1: Sample of execution of a Spark Notebook cell.
Notebooks help the exploration of datasets, but there are common challenges faced by companies that adopt them: how reuse the code used between notebooks; how to execute notebooks created in the exploration phase in production; how to schedule the notebook for periodic batch execution; how to distribute the visualization charts created to be viewed by end users.
Data exploration is an important step in a Data Science project. It explores the content of datasets, applying several transformations and other operations to get insights. In the last few years, it has become very common to use notebooks for data exploration. Notebooks allow Data Scientists to create the data transformation code in parts, grouping it in cells. After creating a cell, we can execute it and get the result (output), that can be a text or a chart, thus allowing for interactive exploration.
Data exploration using notebooks are usually made using operations provided by languages like Python, Scala, Java, using Apache Spark for Big Data processing or not. Spark SQL is a library to manipulate the data which provides the option to execute SQL instructions in your datasets and it is very useful when exploring large datasets.
Although largely used, notebooks also add a few challenges to companies that want to use them in an enterprise environment:
- When exploring a large dataset, it is usually better to use sample that represents the dataset, mainly because in this moment we are trying to understand the dataset and get some useful information, and we don’t want to wait for a long execution over the full dataset. After the exploration phase using the sample, we need to run the process using the full dataset;
- Usually the experimentation notebooks are created by the Data Science team, that after finishing the operations and validating your results, send the notebooks to the Data Engineering team, to be transformed in a programmed pipeline, and they need to schedule to execute periodically in production. Many times this means reimplementing the notebook code in another language or using another framework that is more adequate for batch execution;
- The notebook isn’t the better environment to the end users and others interested in visualizing the data or the charts that are in the middle of the pipeline, because these charts will be available in an interface that contains the code used to generate them. Ideally, the customers should see your charts in an appropriate environment, like a dashboard composed by charts created by many different pipelines; and getting the manipulated data in a file that can be used by another application.
At Tail, we execute almost 5,000 pipelines per day, this without taking into consideration the pipelines that take more than 24 hours to execute. Obviously, this means there is a need to improve the way these pipelines are created, deployed and monitored.
As notebooks are great for experimentation, and in the end they represent a pipeline, we decided to develop an application that executes directly files in Spark Notebook format in production. (In the Spark Notebook GitHub repository there is a sample of this file format). This way, we eliminate the gap between experimentation and production, making the creation of pipelines easier and more productive. Spark Notebook is written in Scala and this way we can pack it as a dependency of our project. This way, we call directly the code to execute the notebook cell by cell. We added a layer that allows us to send parameters to the notebook execution, allowing, for example, to inform which dataset should be used for a particular execution.
With the possibility of executing a Spark Notebook, the same notebook can be used to explore the data and to use in production. Depending on the operations executed by the notebook over a dataset, we may need to lock the dataset, and if necessary we queue the others notebooks execution that will use the same locked dataset, so when the dataset became available we execute the next notebook.
We schedule the execution of each notebook and after the execution we take the opportunity to save the output log, generated by the Spark Notebook with the execution process, cell by cell. This log is generated in case of problems in the notebook execution, and it also allows understanding the root of the problem. Besides that, we copy the charts generated by the notebook from the execution log to an external storage; so we can show the charts in a dashboard with a more pleasant interface. We can also export the output of a notebook to an external file.
In Figure 2, we have the architecture of the automated notebook execution, and this architecture is used to explore using a sample of dataset, or to schedule your execution using the complete dataset.
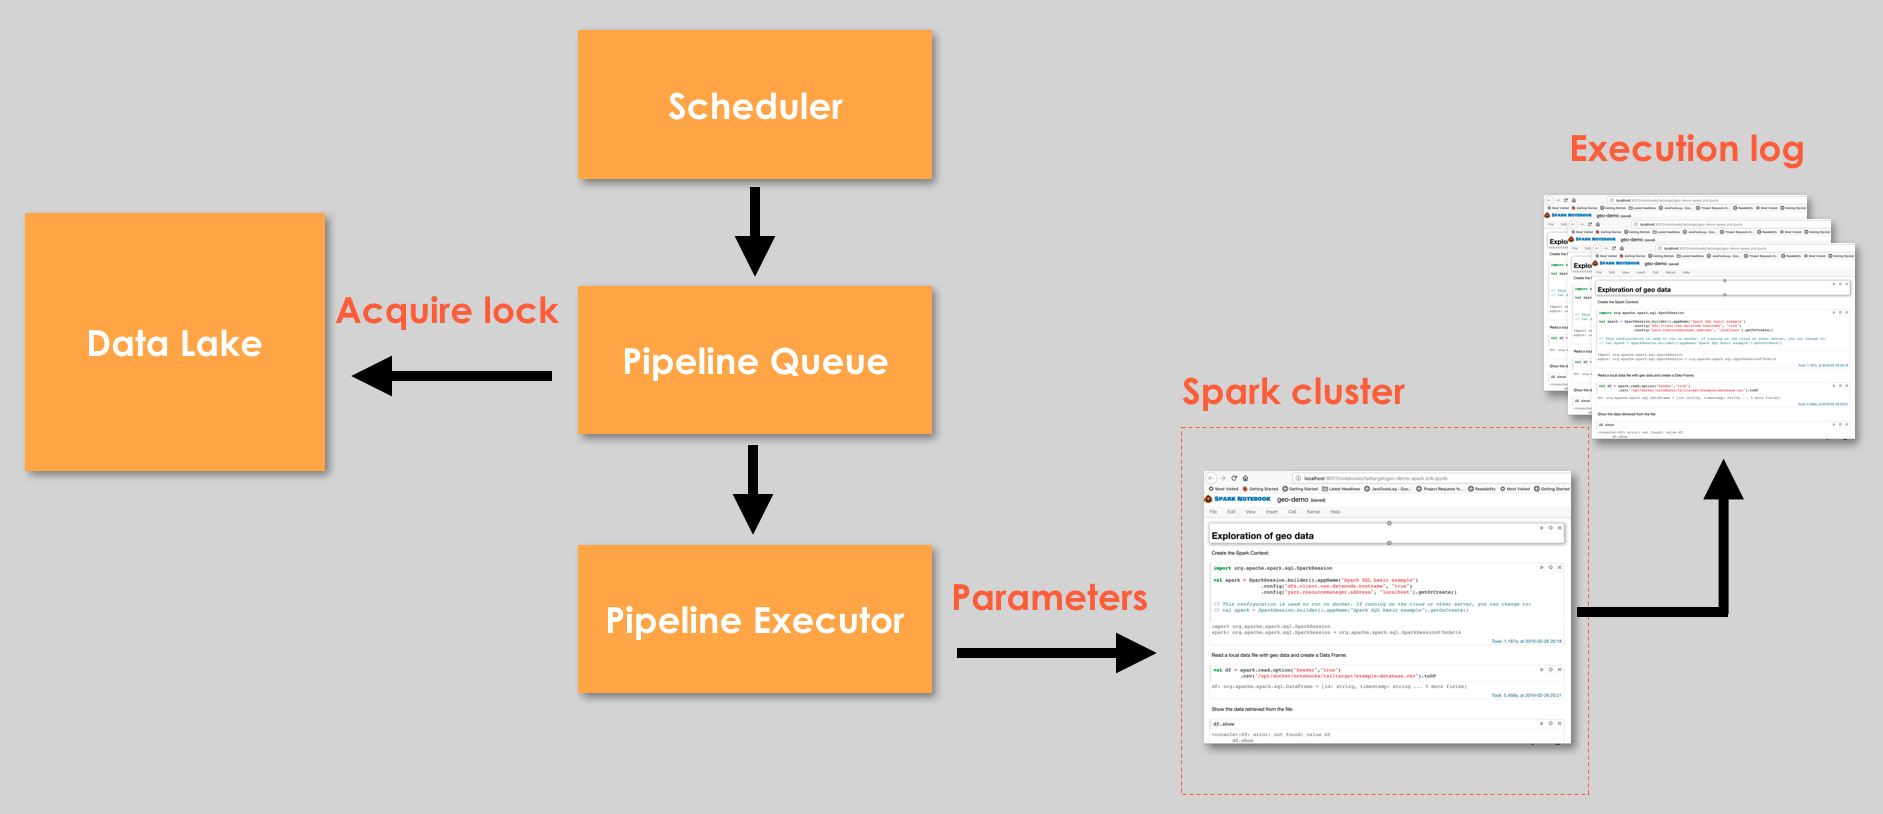
Figure 2: Architecture of automating Spark Notebooks execution.
Spark Notebook provides some basic charts like: Bar, Pie, Graph and Geo, but to generate another visualizations, we need to create new charts. The Spark Notebook allows to create your own charts, following the documentation, so we create a module inside our project that generates new charts and we import in the notebook as an external library, so we can execute the notebooks using our personalized charts.
With these changes, we can execute in production the same notebook used in exploration, scheduling notebook executions. And we have a dashboard to visualize all charts generated.